
About this Course
Power BI is a robust business analytics and visualization tool from Microsoft that helps data professionals bring their data to life and tell more meaningful stores.
This course teaches you how to do Data Analysis and Visualization in Microsoft Power BI Desktop.
You want to analyze data from single or multiple sources? You want to create your individual datasets based on these sources and transform your results into beautiful and easy-to-make visualizations? You also want to share your results with colleagues or collaborate on your projects? Finally, you want to be able to access your data from multiple devices? Then the Power BI tools are the tools to choose for you!
COURSE COST
NGN 150,000
TIMELINE
8 Days
SKILL LEVEL
Advanced
INCLUDE IN THE COURSE
Rich Learning
Content
Taught by
Industry Pros
Student Support
Community
Interactive Quizzes
Self-Paced Learning
Join the Path to Greatness
This course is one of your fundamental step towards a new career building of confidence in Become A Data Scientist at Greaterheight Academy Program.
OUR COURSE
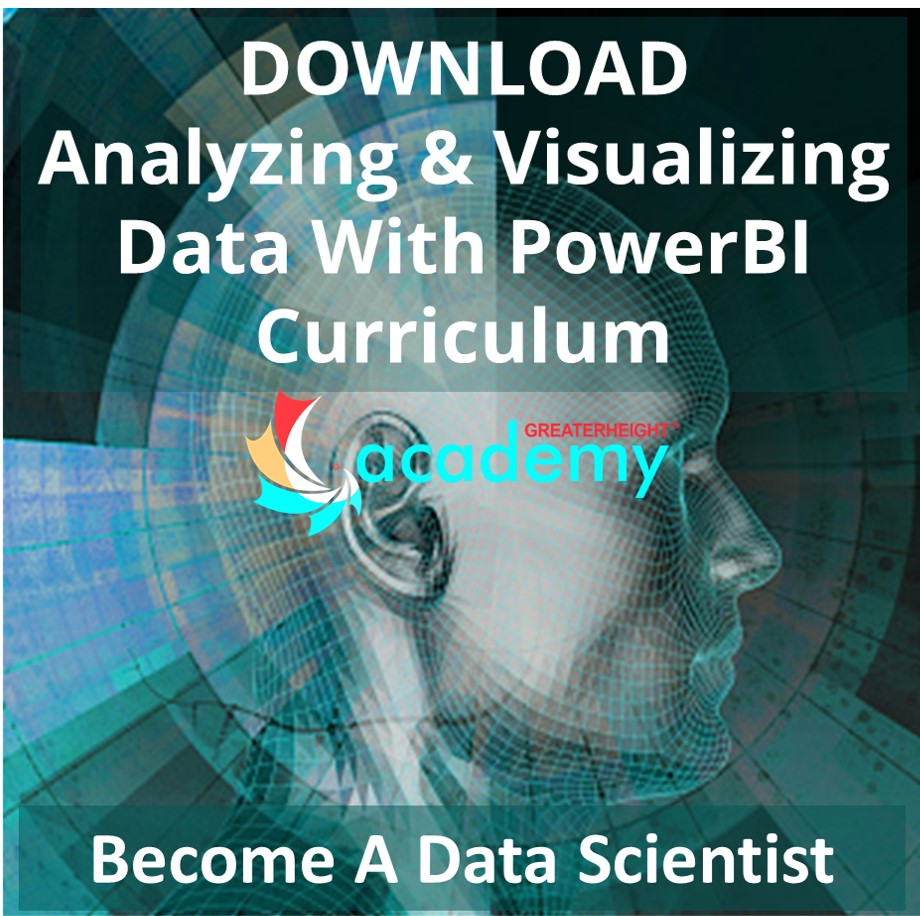
Analyzing And Visualizing Data With PowerBI
Enhance your skill set and boost your hirability through innovative, independent learning.
GREATERHEIGHT ACADEMY PROGRAM
Become A Data Scientist
Accelerate your career with the viable confidential credentials that fast-tracks you into a job and or business success.
LEARN MORE
| Date | Venue | Course Fee Before 28 June 2022 |
Course Fee Before 2 September 2022 |
|---|---|---|---|
|
6 – 16 May 2022
|
17B Debo Aina Crescent, Off Adeymo Akapo Street, Omole Phase I, Ojodu
|
NGN 150,000
|
NGN 310,000
|
| Date | Venue | Course Fee Before 28 June 2022 |
Course Fee Before 2 September 2022 |
|---|---|---|---|
|
6 – 16 May 2022
|
17B Debo Aina Crescent, Off Adeymo Akapo Street, Omole Phase I, Ojodu
|
NGN 150,000
|
NGN 310,000
|
| Date | Venue | Course Fee Before 28 June 2022 |
Course Fee Before 2 September 2022 |
|---|---|---|---|
|
6 – 16 May 2022
|
17B Debo Aina Crescent, Off Adeymo Akapo Street, Omole Phase I, Ojodu
|
NGN 150,000
|
NGN 310,000
|
| Date | Venue | Course Fee Before 28 June 2022 |
Course Fee Before 2 September 2022 |
|---|---|---|---|
|
6 – 16 May 2022
|
17B Debo Aina Crescent, Off Adeymo Akapo Street, Omole Phase I, Ojodu
|
NGN 150,000
|
NGN 310,000
|
Course fees include documentation, luncheon and refreshments. Delegates who attend all sessions and successfully complete the course assessment will receive Certificate of Completion.
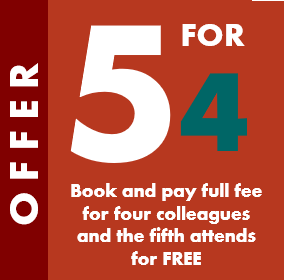
*Book and pay full fee for two colleagues and the third attends for FREE
- Not applicable in conjunction with corporate discounts
- Payment to be settled before start of the course to avail the offer
- This offer is not applicable on Early Bird Prices
For more information, email GreaterHeight Academy on info@greaterheight.academy
Who Should Attend This Course
- People who never worked with Power BI and who want to understand how to use these tools
- People who want to learn to analyze and to visualize the data in Microsoft Power BI
- People with no or less knowledge of Data Analysis and Visualization
- Students of Business operations
- Owners of any business who want to see the day-to-day position of their business
- Everyone who wants to be an expert in Data Analytics and Microsoft Power BI
Prerequisites and Requirements
PC with Microsoft Windows; Basic understanding of Data Analysis and Data Visualization (but not mandatory); and Microsoft Power BI Desktop installed on your system
See the Technology Requirements for using GreaterHeightAcademy.
Why Take This Course?
At the end of this course students will understand:
- Get to know the different tools of the Power BI universe and learn how to use them
- Understand Power BI Desktop and its components
- Learn how to use the Query Editor to connect Power BI to various source types, how to work on the Data Model, and understand the difference between those two steps
- How to work in the different views of the Data Model
- How to create calculated columns and measures
- How to create a report with different interactive visualization types
WHAT DO I GET?
Instructor
Materials
Learn by doing exercises
and assignments
Taught by industry
professionals
Documentation
Launcheon
Certificate of
completion
WHAT YOU WILL LEARN
Lesson 1
INTRODUCTION TO MICROSOFT POWER BI
- What is Power BI?
- Why Power BI?
- Power BI Family
- Power BI Service
- Power BI Desktop
- Quiz & Questions
Lesson 2
DATA INGESTION AND IMPORTING
- Data Ingestion and Importing
- Import data from CSV
- LAB: Importing data from CSV
- Import data from Excel
Lesson 3
DATA CLEANING
- Power Query
- LAB: Power Query
- Append Queries
- LAB: Append Queries
- Merge Queries
- LAB: Merge Queries
- Quiz & Questions

Related Courses
Our Popular Courses
GET THE INFO FROM AN EXPERT
Dive deep into the curriculum, the course structure, and what you can achieve from a course mentor.
See if this program is a fit for you. Meet the GreaterHeight team, get an overview of the program curriculum, and chat with other students thinking about this program.

Analyzing And Visualizing Data With PowerBI information Session
By providing us with your email, you agree to the terms of our Privacy Policy and Terms of Services.
FAQs
We love questions, almost as much aswelove providing answers.Here are a few samplings of what we're typically asked, along with our responses.
Greaterheight Academy strives to provide the latest, best-quality content that’s up to date with current industry standards. Our experienced and certified trainers are subject matter experts who constantly research the latest trends and infuse them into our training programs. Every change happening in the market is immediately considered and our training content is regularly upgraded and updated to reflect current market trends.
- Get to know the different tools of the Power BI universe and learn how to use them
- Understand Power BI Desktop and its components
- Learn how to use the Query Editor to connect Power BI to various source types, how to work on the Data Model, and understand the difference between those two steps
- How to work in the different views of the Data Model
- How to create calculated columns and measures
- How to create a report with different interactive visualization types
Creative, dynamic, and serious minded Student, Managers in various fields, Marketers and Sales Executives, Data Analysts, Database Engineer, Big Data Engineer and reps and that are looking forward to be porfessionals Data Science Engineer.
You will create a project (see also our project section) as following:
- At the end of this course students will be able to analyze data from different data sources and create their own datasets
- Importing data from CSV, Excel and other sources in Power BI
- Data Analytics
- Different Data Visualization techniques
- Students will have the required knowledge to dive deeper into Power BI and find out more about its advanced features