

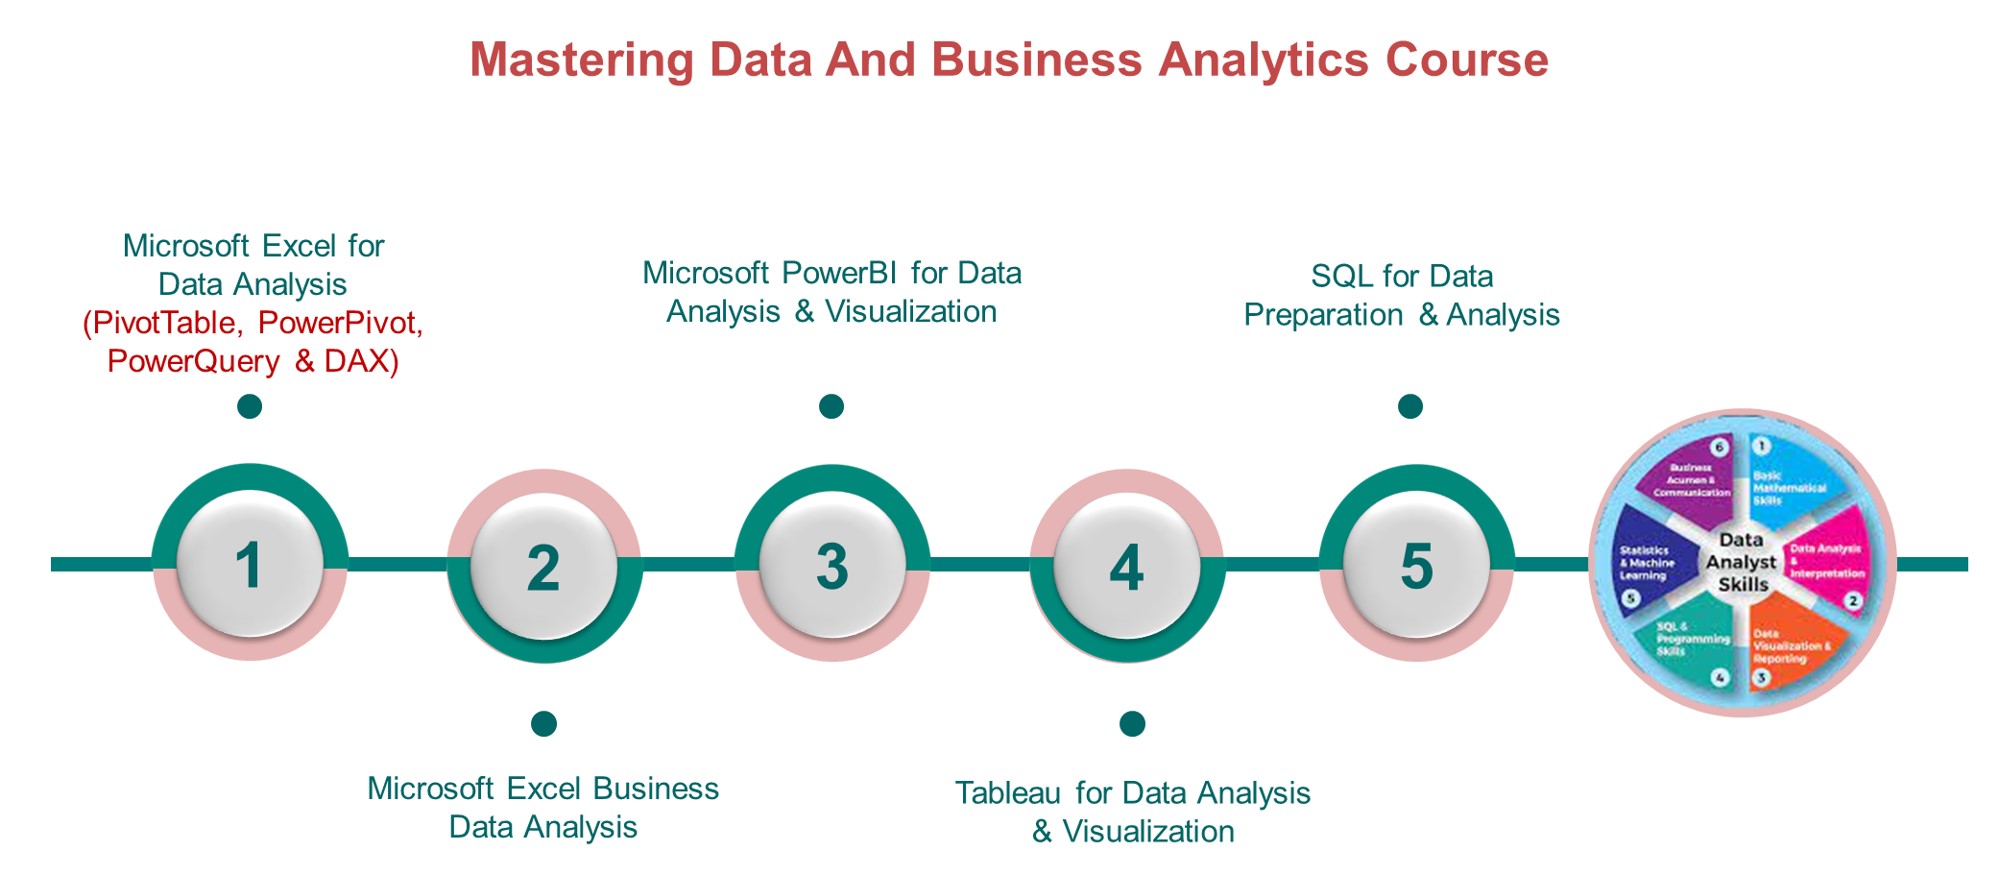
Become a Data Analyst - Master Excel, PowerBI, Tableau & SQL
- The key knowledge needed for Excel Data Analyst are Pivot tables and pivot charts, Conditional formatting, Remove duplicates, XLookup, IFERROR, MATCH, COUNTBLANK, DAYS and NETWORKDAYS, RANK, SUMPRODUCT
- The key knowledge needed for PowerBI Data Analyst are Ingest, clean, and transform data; Model data for performance and scalability; Design and create reports for data analysis; Apply and perform advanced report analytics; & Manage and share report assets.
- The basic knowledge needed for Tableau Data Analyst are Basic data comprehension, Preparing data for effective analysis, Writing efficient code, Math and statistic skills, Analytical and visualization skills, & Tableau software.
- For SQL Data Analyst, you learn 1. The basic commands for DDL commands include create, drop, alter, truncate; DML commands include select, insert, delete, and update. 2. Learn to use filter clauses. 3. Understand how to use aggregate functions 4. Learn about key constraints, date functions, views, and SQL injection. 5. Learn how to implements joins to extract data from different tables. And 6. Advanced SQL queries.

Modules
30+ Modules

Lessons
20+ Lessons

Practicals
23+ Hands-On Labs

Life Projects
5+ Projects

Resume
CV Preparation

Recording
Post Session Recording

Interview
Mock Interviews

Support
On Job Support
Instructor-led Live Online Classes
Our learn-by-building-project method enables you to build practical or coding experience that sticks. 95% of our learners say they have confidence and remember more when they learn by building real world projects which is required to work in your real life.
- Get step-by-step guidance to practice your skills without getting stuck
- Validate your technical problem-solving skills in a real environment
- Troubleshoot complex scenarios to practice what you learned
- Develop production experience that translates into real-world

Why Learn Data Analysis?
Learn In-demand Skills
Those with careers in data analysis learn relevant in-demand skills that span industries and add value to every digital-enabled organization.
Earn a Higher Salary
Experienced data analysts can earn up to $112,000 per year and transition into higher-paying jobs as Senior Data Analysts, Data Scientists, or Analytics Managers.
Positive Job Outlook
The data analytics market is predicted to hit $132.90 Billion USD by 2026. COVID-19 pandemic accelerated the adoption of data analytics solutions and services.

Shape the Future
Data analysts transform organizations by capitalizing on data to improve their business decisions and solve critical real-world problems.
Become a Leader
Being a central part of an organization’s decision-making processes, analytics experts often pick up strong leadership skills as well.
About Data Analysis
GreaterHeight's Analytics experts will teach you to Understand SQL and it's role in Data Analysis. You will develop proficiency in writing complex SQL queries to extract, manipulate, and analyze data.
Develop the skills to clean, transform, and prepare data for analysis using Microsoft Excel.
Learn how to effectively use Power BI to create interactive visualizations. Apply the learned concepts and techniques to real-world data analysis projects.
Gain expertise in Tableau to create compelling data visualizations and interactive reports. Build a solid foundation for a career in data analysis and be prepared for further learning and professional growth in the field.
List of Courses under this Data Analysis Program
Data Analysis with Excel
About Excel Course
Boost your Data analytics career with powerful new Microsoft® Excel skills by taking this Data Analytics course, which includes training on Business Analytics.
To better represent how Ideas makes data analysis simpler, faster and more intuitive, the feature has been renamed to Analyze Data. The experience and functionality is the same and still aligns to the same privacy and licensing regulations. If you're on Semi-Annual Enterprise Channel, you may still see "Ideas" until Excel has been updated.
Analyze Data in Excel empowers you to understand your data through natural language queries that allow you to ask questions about your data without having to write complicated formulas. In addition, Analyze Data provides high-level visual summaries, trends, and patterns.
Data Analysis & Data Visualization in Excel
PivotTables
You will learn how to extract valuable insights and uncover secrets hidden within your data using the power of PivotTables. Additionally, you’ll learn how to use keyboard shortcuts to speed up your workflow.
Intermediate Logical Functions
You’ll identify your ideal customer profile using logical functions and create targeted marketing strategies. You’ll explore the concept of customer segmentation and gain the skills to maximize customer success, increase revenue and boost business growth.
What-if Analysis
You’ll master the art of scenario analysis using Excel’s built-in What-If Analysis tool. You’ll understand how different variables can impact your sales, perform sensitivity analysis and use it to make informed predictions to stay ahead in dynamic business environments.
Forecasting
You will unlock the power of forecasting to anticipate future trends and visualize this data for your stakeholders. You’ll leverage moving averages and trendlines to communicate your findings.
01. Introduction to Business Analytics
02. Learning Objectives
03. Types of Analytics
04. Areas of Analytics
05. Quick Recap
06. Knowledge Check
01 Learning Objectives
02 Sort and filter
03 Group by and subtotal
04 Text to Column
05 Removing Duplicates
06 Data Validation
07 Quick Recap
01 Introduction to Custom Formatting
02 Custom Formatting: Example
03 Introduction to Conditional Formatting
04 Conditional Formatting: Example One
05 Conditional Formatting: Example Two
06 Conditional Formatting: Example Three
07 Logical Functions
08 Lookup and reference functions
09 VLOOKUP Function
10 HLOOKUP Function
11 MATCH Function
12 INDEX and OFFSET Function
13 Statistical functions
14 SUMIFS Function
15 COUNTIFS Function
16 PERCENTILE and QUARTILE
17 STDEV, MEDIAN and RANK Function
18 Exercise: Introduction
19 Exercise
20 Quick Recap
01 Introduction to Pivot tables
02 Creating a Pivot Table
03 Grouping in Pivot tables
04 Grouping in Pivot Table: Example One
05 Grouping in Pivot Table: Example Two
06 Custom Calculation
07 Calculated Field and Calculated Item
08 Calculated Field Example
09 Calculated Item Example
10 Slicer introduction
11 Creating a Slicer
12 Exercise
13 Quick Recap
01 What is a Dashboard
02 Principles of a Great Dashboard Design
03 How to Create Charts in Excel
04 Chart Formatting
05 Thermometer Chart
06 Pareto Chart
07 Speedometer chart
08 Create a Speedometer Chart
09 Stacked Column Chart
10 Funnel chart
11 Pivot Chart
12 Form Controls in Excel
13 Interactive Dashboard with Form Control
14 Chart with Checkbox
15 Chart With Combobox
16 Chart With Scrollbar
17 Interactive Chart
18 Exercise One
19 Exercise Two
20 Quick Recap
01 Introduction
02 Histogram
03 Solver Add in
04 Goal Seek
05 Data Table
06 Descriptive Statistics
07 Excercise
08 Quick Recap
01 Learning Objectives
02 Using Macros for Analytics
03 Mean of Data Using Macros
04 5 Point Summary Using Macros
05 Correlation Coefficient Using Macros
06 Removing Duplicates Using Macros
07 Quick Recap
Advancing to more complex charts Ready to further enhance your charting skills with Excel? You will explore how to work with dual series and prepare more advanced charts, such as Bullet charts, Waterfall charts, or Scatter plots. Additionally, we will investigate various chart editing options.
Data Visualization best practices Like any discipline, data visualization has its best practices, and it's time to take a closer look at the dos and don'ts. We will improve our skills in selecting chart elements, applying colors, legends, and labels, while also learning how to troubleshoot and customize poorly designed visuals for the benefit of end users.
Visualizing disaggregated data with PivotCharts Get ready for an exciting journey into the world of visualizing disaggregated data! We'll explore PivotTables, PivotCharts, and how to combine them into a dynamic mini-dashboard. Are you ready to unlock the true power of your data?
01. Getting started with data visualization in Excel
02. Truth or a myth?
03. Building the first charts
04. Comparing Contributions
05. Visualizing Contribution Differently
06. How are we doing on Sales?
07. Visualizing Sales per Segment
08. Quarterly Sales per Region
01. Exploring more complex charts
02. Pick the right chart!
03. Bullet, waterfall charts, and scatter plots
04. Tracking several measures
05. Comparing versus the average
06. Quarterly profit walkthrough
07 Regional performance quadrant
01. The art of data visualization
02. Misleading news?
03. Chart Clinic 1 on 1
04. Visualizing evolution
05. Accenting lines
06. Fixing a 3D chart
07. Colorful charts
01. Visualizing disaggregated data with PivotCharts
02. Aggregate or disaggregate - that is the question!
03. Pivot Charts in action
04. Basic PivotCharts
05. Exploring data with PivotCharts
06. Building a dashboard
07. Printing our results
08. Congratulations
Data Analysis with Power BI
About Power BI Course
In this course, you’ll gain a 360° overview of the Power BI can do and learn how to use the tool to build impactful reports. In this course, you’ll go from zero to hero as you discover how to use this popular business intelligence platform through hands-on exercises. Before diving into creating visualizations using Power BI's drag-and-drop functionality, you’ll first learn how to confidently load and transform data using Power Query and the importance of data models. You’ll also learn to drill down into reports and make your reports fully interactive.
You’ll start by looking at some of the fundamentals of Power BI, getting to grips with Data, Model, and Report views. You’ll learn to load data sets, build a data model, and discover how to shape and transform your data with Power Query Editor. As you progress through the course, you’ll have access to hands-on exercises that can hone your skills. You’ll look at various visualizations, sort different data types, and learn to drill deeper into your reports.
Once you've covered Power BI in general, you can dig into its options for data visualization. Learn to choose the right visual for your dataset and type, how to make changes to follow visualization best practices and tell a strong story with your data, and learn to sort and format your data for clearer storytelling.
Data Analysis with Power BI Course Contents
01. What is Power BI?
02. Why Power BI?
03. Advantages Of Power BI
04. Disadvantages Of Power BI
05. Power BI Architecture
06. Power BI Service
07. Power BI Dashboard
08. Components of Power BI
09. Features of Power BI
10. Power BI Career Opportunities
11. Power BI Certifications
12. Power BI Analyst Salary
13. Versions Of Power BI
14. Who Uses Power BI Applications?
15. Case Study on Meijer
16. Demo using Power BI
17. Conclusion
01. What is Power BI?
02. Features of Power BI
03. What is a Power BI Dashboard?
04. Advantages of a Power BI dashboard
05. Power BI Dashboards vs Report
06. sHow to Create a Dashboard in Power BI?
07. Exploring the Features of Power BI Service
08. Conclusion
01. What is Power BI?
02. What is Tableau?
03. Features of Power BI
04. Features of Tableau
05. Key Difference between Power BI and Tableau
06. Advantages of Power BI and Tableau
07. Disadvantages of Power BI and Tableau
08. Tableau Products
09. Power BI Products
10. History of Power BI and Tableau
11. Cost of Power BI and Tableau
12. Performance of Power BI and Tableau
13. User Interface of Power BI and Tableau
14. Data Sources in Power BI and Tableau
15. Ease of Using Power BI and Tableau
16. Programming Support for Power BI and Tableau
17. Data Visualization in Power BI and Tableau
18. Machine Learning in Power BI and Tableau
19. Customer Support in Power BI and Tableau
20. Google Trends
21. What is the Possible Answer?
22. FAQs
Data Analysis with Tableau
About Tableau Course
Tableau is a widely used BI and analytics software trusted by companies like Amazon and Unilever to explore, create, and securely share contextualized data. In this course, you will learn how to build data visualizations, conduct data analyses and adopt best practices of data formatting with Tableau.
With its user-friendly drag-and-drop functionality, Tableau can be used by everyone to quickly clean, analyze, and visualize your team’s data. This course can show you how. You’ll begin the course by understanding Tableau’s fundamental concepts and features, such as how to load data and workbooks and understanding the interface. You will then create your first visualization with Tableau using an Airbnb dataset.
The final course explore best practices for formatting and presenting your data with Tableau, including creating a dual-axis graph, understanding the differences between a worksheet, dashboard, and story, and finally, creating your very first Tableau dashboard. By the end of this course, you’ll have the skills you need to confidently explore Tableau and build impactful data dashboards. Check out our Tableau Fundamentals track to further develop your Tableau skills.
Data Analysis with Tableau Course Contents
01. What is Tableau
02. Functions in Tableau
01 Learning Objectives
02 What is Business Intelligence
03 Data Visualization
04 Benefits of Visualizing Raw Data
05 History of Data Visualization
06 Introduction to Tableau
07 Advantages and Disadvantages of Tableau
08 Download and Install Tableau Public
09 Load Data from Excel
10 User Interface of Tableau Public
11 Recap
01 Learning Objectives
02 Connecting to Tableau Server
03 Types of Connections
04 Connecting to Different Data Source
05 Preparing Data for Analysis
06 Joins
07 Relationships
08 Union
09 Data Blending
10 Aggregation in Tableau
11 Pivot
12 Data Interpreter
13 Split
14 Creating extracts with multiple tables
15 Recap
01 Learning Objectives
02 Data Types
03 Dimension vs Measures
04 Discrete vs. Continuous
05 Application of Discrete and Continuous Fields
06 Rename Hide Unhide and Sort Columns
07 Default Properties of Fields
08 Create Aliases
09 Recap
01 Learning Objectives
02 Dimension Filter
03 Measure Filter
04 Date Filter
05 Visual Filter
06 Interactive Filter
07 Data source Filter
08 Context Filter
09 Recap
01 Learning Objectives
02 Sort
03 Group
04 Sets
05 Bins and Histogram
06 Hierarchies
07 Quick Recap
01 Learning Objectives
02 Text table and Cross table
03 Highlight Tables
04 Heat Maps
05 Bar Chart
06 Stacked Bar Chart
07 Line Chart
08 Sparkline
09 Scatter Plot
10 Tree Map
11 Bubble chart
12 Word Cloud
13 Combined-Axis Chart
14 Dual-Axis Charts
15 Funnel Chart
16 Importance of Maps
17 Creating Maps with Tableau
18 How to Pan Zoom and Select in Tableau
19 Using Maps to Filter Data
20 Map Layering
21 Creating Custom Territories
22 Modifying Locations within Tableau
23 Geocoding
24 Using Background Image
25 Tableau Map Search
26 Recap
01 Learning Objectives
02 Types of Calculation
03 Ad-hoc Calculations
04 Table Calculations
05 Waterfall Chart
06 Pareto Chart
07 Built in Functions
08 Introduction to Level of Detail (LOD)
09 Fixed LOD
10 Include LOD
11 Exclude LOD
12 Nested LOD Expressions
13 Aggregation and Replication with LOD Expressions
14 Helper Functions
15 KPI Table
16 Recap
01 Learning Objectives
02 Parameters
03 Creating Parameters
04 Parameters with Filters
05 Parameters in Calculations
06 Column Selection Parameters
07 Chart Selection Parameters
08 Tooltips
09 Tooltip Visualizations
10 Reference and Trend Lines
11 Reference Bands
12 Distribution Bands
13 Bullet Chart
14 Box Plot
15 Forecasting
16 Clustering
17 Reference Distributions
18 Statistical Summary Card
19 Instant Analytics
20 Recap
01 Learning Objectives
02 Dashboard
03 Working with Layout
04 Objects in Dashboard
05 Dashboard Layouts and Formatting
06 Building Interactive Dashboard
07 Actions in Dashboard
08 Best Practices for Dashboard Creation
09 Dashboards for Mobile
10 Introduction to Storyboard
11 Creating and Updating Story Points
12 Publishing and Sharing Options
13 Recap
Data Analysis with SQL
About SQL Course
Much of the world's raw data—from electronic medical records to customer transaction histories—lives in organized collections of tables called relational databases. Being able to wrangle and extract data from these databases using SQL is an essential skill within the data industry and in increasing demand.
In just two hours, you'll get to know the theory and the practice through bite-sized videos and interactive exercises where you can put your new-found skills to the test.
SQL is an essential language for building and maintaining relational databases, which opens the door to a range of careers in the data industry and beyond. You’ll start this course by covering data organization, tables, and best practices for database construction.
The second half of this course looks at creating SQL queries for selecting data that you need from your database. You’ll have the chance to practice your querying skills before moving on to customizing and saving your results.
PostgreSQL and SQL Server are two of the most popular SQL flavors. You’ll finish off this course by looking at the differences, benefits, and applications of each. By the end of the course, you’ll have some hands-on experience in learning SQL and the grounding to start applying it to projects or continue your learning in a more specialized direction.
Data Analysis with SQL Course Contents
01 Course Introduction
02 Demo SQL Lab Walk - Through
01 Introduction to Databases
02 Introduction to Database Management System
03 DBMS vs RDBMS
04 Introduction to SQL
05 Tables in SQL
06 Relationships in SQL
07 Views in SQL
08 Table vs Views
09 Quick Recap
01 Introduction
02 Entity Relationship Model
03 Recap
01 Introduction
02 Downloading SQL Express Edition
03 Installing SQL Express Edition
04 Configuring SQL Express Edition and Workbench
05 Connecting to SQL Server
06 Demo Downloading Sample SQL Database in SQL Workbench
07 Recap
01 Introduction
02 Database Manipulation in SQL
03 Transactions and ACID Properties in SQL
04 SQL Storage Engines
05 Creating and Managing Tables in SQL
06 Creating and Managing Tables in SQL CREATE, DESCRIBE, and SHOW Table
07 Creating and Managing Tables in SQL ALTER, TRUNCATE, and DROP Tables
08 Inserting and Querying Data in Tables
09 Filtering Data From Tables in SQL
10 Filtering Data From Tables in SQL WHERE and DISTINCT Clauses
11 Filtering Data From Tables in SQL AND and OR Operators
12 Filtering Data From Tables in SQL IN and NOT IN Operators
13 Filtering Data From Tables in SQL BETWEEN and LIKE Operators
14 Filtering Data From Tables in SQL LIMIT, IS NULL, and IS NOT NULL Operators
15 Sorting Table Data
16 Comments in SQL
17 Recap
01 Introduction
02 Operators in SQL
03 Indexing in SQL
04 Order of Execution in SQL
05 Assisted Practice Constraint
06 Data Types in SQL
07 School Ranking Analysis
08 Recap
01 Introduction
02 Understanding SQL Functions
03 Aggregate Functions
04 Scalar Functions
05 String Functions
06 Numeric Functions
07 Date and Time Functions
08 Handling Duplicate Records
09 Miscellaneous Functions
10 General Functions
11 Recap
12 Patient Diagnosis Report
01 Introduction
02 Introduction to Alias
03 Introduction to JOINS
04 Right Cross and Self Join
05 Operators in SQL
06 Operators in SQL Updated
07 Intersect and Emulation
08 Minus and Emulation
09 Subquery in SQL
10 Subqueries with Statements and Operators
11 Subqueries with Commands
12 Derived Tables in SQL
13 EXISTS Operator
14 NOT EXISTS Operator
15 EXISTS vs IN Operators
16 Employee Data Analysis
17 Recap
01 Introduction to Window Function
02 Window Function Syntax
03 Aggregate Window Functions
04 Ranking Window Functions
05 Miscellaneous Window Functions
06 Miscellaneous Window Functions FIRST VALUE NTH VALUE and NTILE
07 Miscellaneous Window Functions CUME DIST LEAD LAG and LAST VALUE
08 Recap
10 Spotlight
BECOME A DATA ANALYST
Data Analysis with Excel, Powerbi, Tableau & SQL Course Cost
GreaterHeight Academy Benefits
Unlimited Live Sessions
Live Training Membership give you unlimited access to all our live training and sessions recording from anywhere and using any device staying at home.
Expert-led Live Sessions
All sessions are led by our expert mentors who are well connected to the open-source communities. They explain complex technical concepts in an easy way.
Test and Quizzes
Each Module will be followed by mock-up tests and quizzes which help you to monitor your learning progress and evaluate yourself.
Build Real-Projects
All the sessions are delivered using real-life. You will learn how to build real projects using industry recommended principles & practices.
Personal Career Coach
Get career guidance from top experts as your personal coach, align your preparation strategy & learning resources to achieve your goal.
Interview Prep Sessions
Get career guidance and ask your questions & doubts live. Join to prepare yourself for next job interview to crack and get hired!
Resume Building
Optimize your resume with the help of our experienced experts to get your desired jobs.
Hands-on Assignments
Learn by doing hands-on to gain confidence to solve real-world challenges and assignments. Interview Prep Sessions.
Discord Community Accessh
Get access to Discord community to discuss doubts, access assignments and learning with peer interaction.
Technical Support
We have online support team available to help you with any technical queries you may have during the course.
Get Certified
Master in-demand job skills to become a technology expert, get certified, and accelerate your career.
Career & Certifications
- Data Analytics is a process of inspecting, cleaning, transforming and modeling data to discover useful information and support decision making to achieve business goals.
- There are various data analysis qualitative and quantitative methods and analytical or statistical tools used to extract the useful information and translate them into insights to make better business decisions, most of which are covered in the Data Analyst Courses.
- Data analysts play a unique role among the many data-centric jobs often found in today's businesses. A Data Analyst commonly works on collecting and interpreting data, analyzing the outcome, and reporting the results back to the relevant team.
- A Data Analyser also works closely with identifying patterns and trends in data sets, working alongside organizations within the business or the management team to establish business needs, define new data collection and analysis processes, and add real value to a company.
- Some of the top industries using data analysis include Data Assurance, Retail, Finance, Entertainment, Government and Public sector, Higher Education, Sharing economy services, Sales & Marketing, Agriculture, Business Intelligence, Healthcare, and Data Quality.
- There is undoubtedly great demand for data analytics as 96% of organizations seek to hire Data Analysts. The most significant data analyst companies that employ graduates who wish to have a data analyst career are Manthan, SAP, Oracle, Accenture Analytics, Alteryx, Qlik, Mu Sigma Analytics, Fractal Analytics, and Tiger Analytics. Professional Data Analyst training will make you become a magician of any organization, and you will spin insights by playing with big data.
Many analyst roles are pretty nuanced, and therefore, it is hard to determine which skills are needed significantly. Data Analyst course is an increasingly worthwhile investment and helps you secure the right skills with better pay. Some of the top skills required for data analysts are:
- Structured Query Language (SQL)
- Microsoft Excel
- Data Visualization
- Data Cleaning
- Presentation Skills
- Critical Thinking
- Career openings are available practically from all industries, from telecommunications to retail, banking, healthcare, and even fitness. Without extensive training and effort, it isn't easy to get data analyst career benefits. So, earning our Data Analyst certification will allow you to keep up-to-date on recent trends in the industry.
FAQs
You will work on highly exciting projects in the domains of high technology, ecommerce, marketing, sales, networking, banking, insurance, etc. After completing the projects successfully, your skills will be equal to 6 months of rigorous industry experience.