


Become a Data Analytics & Visualization Expert - Data Analytics, Science, & Visualization Using Python - Pandas, Numpy, Matplotlib, Seaborn AND AZURE SQL
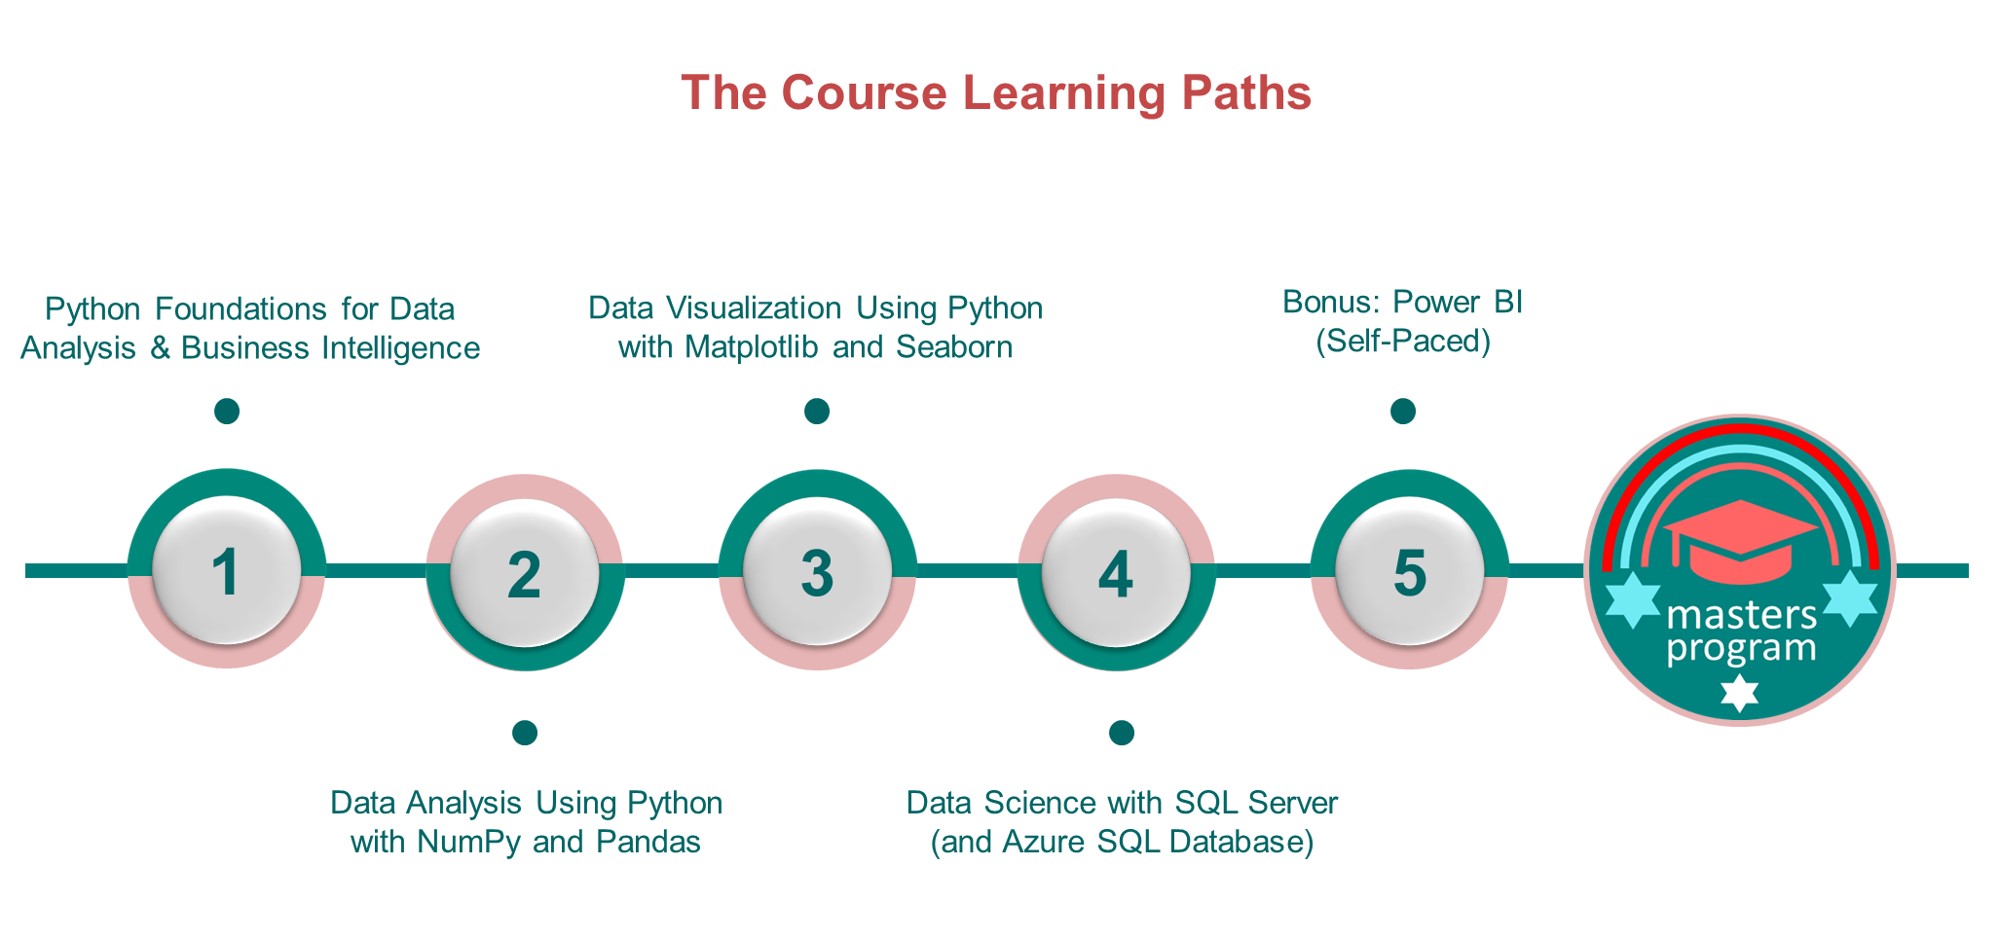
- Python Foundations for Data Analysis & Business Intelligence. Master the building blocks of base Python, including data types, variables, loops, functions. Learn how to use Jupyter Notebooks to write, manage, and comment your Python code Analyze and manipulate numeric data, text strings, lists, tuples, dictionaries and sets. Explore raw data using conditional logic, nested loops, custom functions, and comprehensions. Use Python's Openpyxl package to read & write data to Excel worksheets. Build solid, foundational Python skills for data analysis & business intelligence
- Data Analysis Using Python with NumPy and Pandas. GreaterHeight's experienced professionals created this training to match the current industry requirements and demands. Our Data Analytics Expert program with Python Certification takes a training from fundamentals to advanced topics like Pandas, Numpy, and machine learning, it suits both professionals and beginners.
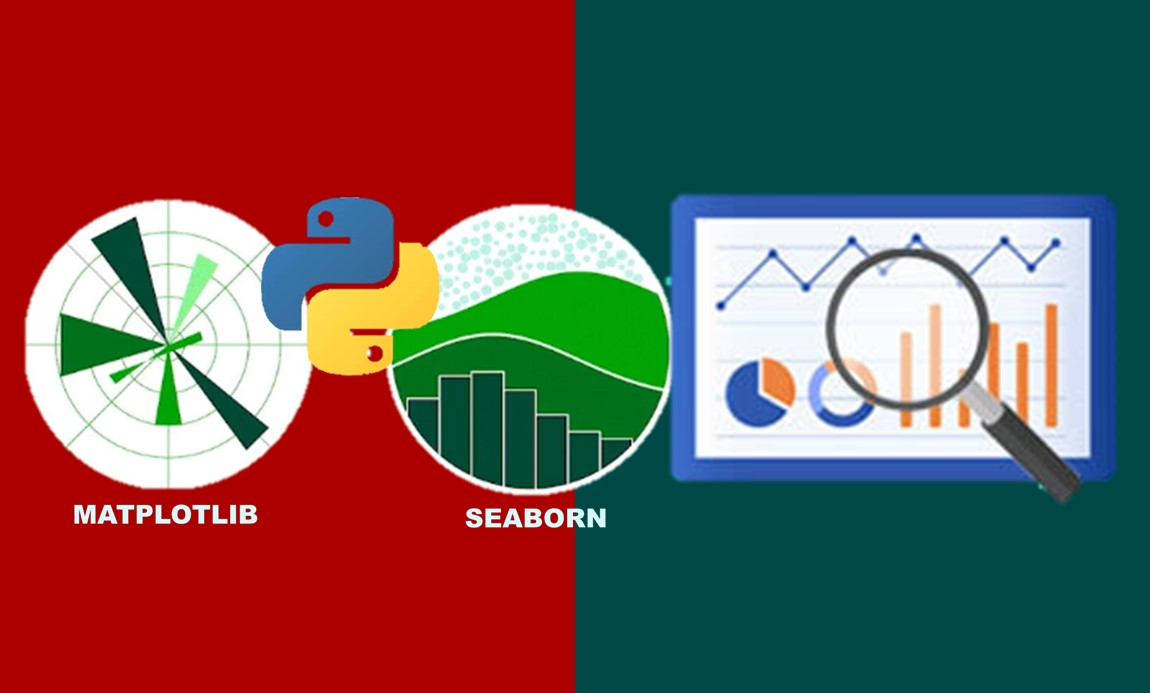
- Data Visualisation Using Python with Matplotlib and Seaborn. Python has a lot of libraries for visualizing data, out of which matplotlib and seaborn are the most common. In this building block we construct the plots defined in Data Visualization Theory and Best Practices with both matplotlib and seaborn.
- Data Analysis Using Azure SQL (Self-Paced). Azure Analysis Services is a fully managed platform as a service (PaaS) that provides enterprise-grade data models in the cloud. Use advanced mashup and modeling features to combine data from multiple data sources, define metrics, and secure your data in a single, trusted tabular semantic data model. The data model provides an easier and faster way for users to perform ad hoc data analysis using tools like Power BI and Excel.
- Bonus: Power BI (Self-Paced). The key knowledge needed for PowerBI Data Analyst are Ingest, clean, and transform data;
Course Benefits & Key Features
Advanced developments of expertise in cleaning, transforming, and modelling data to obtain insight into massive datasets in order to uncover and extract important information for visualisation and corporate decision making as a Senior Data Analyst - Data Analytics, Science, & Visualization Using Python - Pandas, Numpy, Seaborn and Azure SQL.

Modules
30+ Modules

Lessons
20+ Lessons

Practicals
23+ Hands-On Labs

Life Projects
5+ Projects

Resume
CV Preparation

Job
Job Reference

Recording
Session Recording

Interview
Mock Interviews

Support
On Job Support

Membership
Membership Access

Network
Networking

Certification
Certificate of Completion
Instructor-led Live Online Classes
Our learn-by-building-project method enables you to build practical or coding experience that sticks. 95% of our learners say they have confidence and remember more when they learn by building real world projects which is required to work in your real life.
- Get step-by-step guidance to practice your skills without getting stuck
- Validate your technical problem-solving skills in a real environment
- Troubleshoot complex scenarios to practice what you learned
- Develop production experience that translates into real-world

Why Learn Data Analytics and Visualization Expert?
Learn In-demand Skills
Those with careers in data analysis learn relevant in-demand skills that span industries and add value to every digital-enabled organization.
Earn a Higher Salary
Experienced data analysts can earn up to $112,000 per year and transition into higher-paying jobs as Senior Data Analysts, Data Scientists, or Analytics Managers.
Positive Job Outlook
The data analytics market is predicted to hit $132.90 Billion USD by 2026. COVID-19 pandemic accelerated the adoption of data analytics solutions and services.

Shape the Future
Data analysts transform organizations by capitalizing on data to improve their business decisions and solve critical real-world problems.
Become a Leader
Being a central part of an organization’s decision-making processes, analytics experts often pick up strong leadership skills as well.
BECOME A DATA ANALYTICS & VISUALIZATION EXPERT
DATA ANALYSIS, SCIENCE & VISUALIZATION
USING PYTHON - Pandas, Numpy, Matplotlib, Seaborn AND AZURE SQL
GreaterHeight's Data Analytics experts came up with an extensive Program with 5 Courses, 120+ Hours of Interactive Learning, and 5+ Projects and 30+ Assignments. Our training provides advanaced developments of expertise in cleaning, transforming, and modelling data to obtain insight into massive datasets in order to uncover and extract important information for visualisation and corporate decision making as a Senior Data Analyst - Data Analytics, Science, & Visualization Using Python - Pandas, Pandas, Numpy, Matplotlib, Seaborn AND AZURE SQL.
Data Analytics Course Alumni

QUEEN OBIWULU
Team Lead, Customer Success
Investing in the course "Become a Data Analyst" with GreaterHeight Academy is great value for the money and I highly recommend. The trainer is very knowledgable, very engaging, provided us with quality training sessions on all courses and was easily acessible for queries. We also had access to the course materials and also the timely availability of the recorded videos made it easy and aided the learning process.

BISOLA OGUNRO
Fraud Analytics Risk Oversight Manager
The training was fantastic, the instructor is an awesome lecturer, relentless and not tired in his delivery. He obviously enjoys teaching, it comes natural to him. We got more than we expected. He extended my knowledge of Excel beyond what I knew, and the courses were brilliantly delivered. They reach out, follow up, ask questions, and in fact the support has been great. They are highly recommended and I would definitely subscribe to other training programs from them.
TUNDE MEREDITH
Operation Director - Abbfem Technology
It's one thing to look for just a Data Analysis training, and it's another to get the knowledge transferred through certified professional trainers. No matter your initial level of proficiency in any of the Data Analysis tools, GreaterHeight Academy would mmet you there and take you up to a highly proficienct and confident level in a short time at a reasonable pace. I learnt a lot of Data Analysis tools and skills at GreaterHeight from patient and resourseful teachers.

JOHN OSI PETER
Web Developer
The Data Analysis training program was one of the best I have attended. The way GreaterHeight took off with Excel and concluded the four courses with Excel was a mind blowing - it was WOW!! I concluded that I'm on the right path with the right mentor to take me from a novice to professional. GreaterHeight is the best as far as impacting Data Analysis knowledge is concern. I would shout it at the rooftop to recommend GreaterHeight to any trainee that really wants to learn. Thank you, GreaterHeight.
AYODELE PAYNE
Sales/Data Analyst
I wanted to take a moment to express my deepest gratitude for the opportunity to study data analytics at GreaterHeight Academy. When I first considered taking the course, I was hesitant because I was not a fan of coding. However, thanks to the efforts of my educator, I was able to overcome my reservations and now proudly call myself a data analyst.
VIEW MORE
I am shown when someone hovers over the div above.I am truly impressed by the level of dedication and support that the sponsor and CEO have put into this program. GreaterHeight Academy is without a doubt the best tech institution out there, providing top-notch education and resources for its students. Our educator goes above and beyond to ensure that we understand every aspect of the course, leaving no stone unturned.
One of the advantages of studying at GreaterHeight Academy is the access to the best tools and technologies in the field. This hands-on experience has been invaluable in helping me develop my skills and confidence as a data analyst. I am grateful for the opportunity to learn and grow in such a supportive and enriching environment.
Thank you once again for your unwavering support and commitment to providing exceptional education. I am proud to be a part of the GreaterHeight Academy community and look forward to applying my newfound knowledge and skills in my career.
ADEBAYO OLADEJO
Customer Service Advisor (Special Operations)
It is an unforgettable experience that will surely stand the test of time learning to become a Data Analyst with Greater Heights Academy.
The Lecture delivery was so impactful and the Trainer is vast and well knowledgeable in using the applicable tools for the Sessions.
Always ready to go extra mile with you.
VIEW MORE
The supports you get during and after the lectures are top notch with materials and resources available to build your confidence on and off the job.
Another good thing about the Academy are the Recorded Classes which you can access at any time of the day and anywhere in the world 🌎
Don’t wait anymore!
Actualise you dream of becoming A Data Analyst through “Greater Heights Academy”A trial will convince you.
GreaterHeight Certificates holders are prepared to work at companies like these:
Data Analytics & Visualization Expert Courses
Python Foundations for Data Analysis & Business Intelligence Course Contents
We'll dive into foundational tools like variables, numeric and string operators, loops, custom functions, and more. You'll learn how to create and manipulate raw data, define conditional logic, loop through iterables or indices, and extract values stored in a wide variety of data types including dictionaries, lists, tuples, and more.
Using the skills you learn throughout the course, you'll help a business to track inventory, pricing, and sales performance using your Python skills.
WEEK 1-4 | 12 Modules | 28 Hours | 19 Skills
Topics:
01. What is Python?
02. Python for Data Analysis
03. The Python Analytics Ecosystem
04. Data Roles that use Python
Topics:
01. Jupyter Notebooks Intro & Install
02. Launching Jupyter & Creating a Notebook
03. The Jupyter Interface
04. The Code Cell
05. Comments & Markdown
06. The Print Function & Function Help
07. ALTERNATIVE: Google Colab
08. Printing Practice
09. Quiz on Jupyter Notebooks
Topics:
01. Python Data Types
02. The Type Function & Type Conversion
03. Type Function & Conversion
04. Type Function Practice
05. Iterables & Mutability
06. Excercise
Topics:
01. Intro to Variables
02. Variable Assignment
03. Assigning Variables
04. Overwriting Variables
05. Deleting Variables
06. Overwriting & Deleting Variables
07. Variable Naming Rules
08. Keeping Track of Variables
09. Naming & Tracking Variables
10. Variable Naming Rules
11. Excercise
Topics:
01. Intro to Numeric Data
02. Numeric Data Types
03. Numeric Type Conversion
04. Arithmetic Operators & Order of Operations
05. Numeric Data
06. Arithmetic Practice
07. Arithemetic Operators
08. Numeric Functions
09. Numeric Function Practice
10. Excercise
Topics:
01. Intro to Strings
02. String Arithmetic
03. String Creation & Arithmetic
04. String Indexing
05. String Slicing
06. The Length Function
07. String Methods
08. F-Strings
09. Excercise
Topics:
01. The Boolean Data Type
02. Comparison Operators & Membership Tests
03. Boolean Operators
04. Boolean Data Types & Operators
05. Boolean Tests
06. The IF Statement & Control Flow
07. Else & Elif Statements
08. If, Else, Elif
09. Control Flow
10. Nested If Statements
11. Key Takeaways
12. Excercise
Topics:
01. Sequence & List Basics
02. List Operations
03. Adding List Elements
04. Removing List Elements
05. Modifying Lists
06. List Methods & Functions
07. Nesting & Copying Lists
08. Tuples
09. Ranges
10. Key Takeaways
11. Excercise
Topics:
01. Loop Basics
02. For Loops & Looping Over Items
03. For Loops
04. Looping Over Indices & Multiple Iterables
05. Looping over indices
06. Enumerate
07. While Loops
08. Nested Loops
09. Break, Continue & Pass
10. Loop Control
11. Key Takeaways
12. Excercise
Topics:
01. Intro to Dictionaries
02. Accessing & Modifying Dictionary Values
03. Dictionary Operations
04. Dictionary Creation
05. Keys & Values Methods
06. Get, Items & Update Methods
07. Dictionary Methods
08. The Zip Function
09. Nested Dictionaries
10. Intro to Sets
11. Sets
12. Set Operations
13. Set Use Cases
14. Key Takeaways
15. Excercise
Topics:
01. Intro to Functions
02. Anatomy of a Function
03. Defining Functions
04. The Docstring
05. Defining A Function
06. Argument Types
07. Return Values
08. Variable Scope
09. Creating Modules
10. Importing Modules
11. Creating & Importing Modules
12. Importing a Function
13. Importing External Functions
14. Naming Conflicts
15. Installing & Managing Packages
16. The Map Function
17. Lambda Functions
18. List Comprehensions
19. Dictionary Comprehensions
20. Comprehensions vs. Map()
21. Key Takeaways
22. Excercise
Topics:
01. The Openpyxl Package
02. Navigating Excel Workbooks, Worksheets & Cells
03. Missing Sales Tax
04. Determining Ranges & Writing to Cells
05. Writing To Excel From Python
06. Pound & Yen Columns
07. Inserting & Deleting Columns
08. Saving Workbooks
09. Bringing it All Together
10. Key Takeaways
11֫. Excercise
Data Analysis Using Python with NumPy and Pandas Course Contents
From there we'll dive into Pandas, and focus on the essential tools and methods to explore, analyze, aggregate and transform series and dataframes. You'll practice plotting dataframes with charts and graphs, manipulating time-series data, importing and exporting various file types, and combining dataframes using common join methods.
Master the essentials of NumPy and Pandas, two of Python's most powerful data analysis packages. Learn how to explore, transform, aggregate and join NumPy arrays and Pandas DataFrames. Analyze and manipulate dates and times for time intelligence and time-series analysis. Visualize raw data using plot methods and common chart options like line charts, bar charts, scatter plots and histograms. Import and export flat files, Excel workbooks and SQL database tables using Pandas. Build powerful, practical skills for modern analytics and business intelligence.
WEEK 5-8 | 9 Modules | 20 Hours | 19 Skills
Topics:
01. DOWNLOAD: Course Resources
02. Introducing the Course Project
03. Setting Expectations
04. Jupyter Installation & Launch
Topics:
01. Pandas & NumPy Intro
02. Numpy Arrays & Array Properties
03. Array Creation
04. Random Number Generation
05. Indexing & Slicing Arrays
06. Array Operations
07: Filtering Arrays & Modifying Array Values
08. Filtering & Modifying Arrays
09. Array Aggregation
10. Array Functions
11. Sorting Arrays
12. Aggregation & Sorting
13. Vectorization
14. Broadcasting
15. Bringing it all together
16. Key Takeaways
17. Excercise
Topics:
01. Series Basics
02. Pandas Data Types & Type Conversion
03. The Series Index & Custom Indices
04. The .loc Accessor
05. Duplicate Index Values & Resetting The Index
06: Accessing Data & Resetting The Index
07. Filtering Series & Logical Tests
08: Sorting Series
09. Sorting & Filtering Series
10. Numeric Series Operations
11. Text Series Operations
12. Series Operations
13. Numerical Series Aggregation
14. Categorical Series Aggregation
15. Series Aggregation
16. Missing Data Representation in Pandas
17. Identifying Missing Data
18. Fixing Missing Data
19. Applying Custom Functions to Series
20. Pandas Where (vs. NumPy Where)
21. Apply & Where
22. Key Takeaways
23. Excercise
Topics:
01. DataFrame Basics
02. Creating a DataFrame
03. Exploring DataFrames: Heads, Tails & Sample
04. DataFrame Basics
05. Exploring DataFrames: Info & Describe
06. Accessing DataFrame Columns
07. Accessing DataFrame Data with .iloc & .loc
08. Accessing DataFrame Data
09. Dropping Columns & Rows
10. Identifying & Dropping Duplicates
11. Missing Data
12. Filtering DataFrames
13. The Query Method
14. Sorting DataFrames
15. Renaming & Reordering Columns
16. Arithmetic & Boolean Column Creation
17. Advanced Conditional Columns with Select
18. The Select Function
19. The Map Method
20. Multiple Column Creation with Assign
21. Map & Assign
22. The Categorical Data Type
23. Type Conversion
24. Memory Usage & DataTypes
25. Downcasting Numeric Data Types
26. DataFrame DataTypes
27. Key Takeways
28. Excercise
Topics:
01. Basic Aggregations
02. The Groupby Method
03. Groupby
04. Grouping By Multiple Columns
05. Multi-Index DataFrames
06. Modifying Multi-Indices
07. Multi-Index DataFrames
08. The Agg Method & Named Aggregations
09. The Agg Method
10. Transforming DataFrames
11. Transforming a DataFrame
12. Pivot Tables in Pandas
13. Multiple Aggregation Pivot Tables
14. Pivot Table Heatmaps
15. Melting DataFrames
16. Pivot & Melt
17. Key Takeaways
18. Excercise
Topics:
01. The matplotlib API & The .plot() Method
02. Basic Line Chart
03. Chart Titles
04. Line Styles
05. Chart Legends & Gridlines
06. Chart Styles
07. Stylized Line Chart
08. Subplots & Figure Size
09. Bar Charts
10. Grouped & Stacked Bar Charts
11. Pie Charts & Scatterplots
12. Scatterplots
13. Histograms
14. Saving Plots & Further Exploration
15. Key Takeaways
16. Excercise
Topics:
01. Times in Python and Pandas
02. Converting To Datetimes
03. Formatting Dates
04. Date & Time Parts
05. Pandas Datetime Basics
06. Time Deltas & Arithmetic
07. Time Series Indices
08. Missing Time Series Data
09. Shifting Time Series
10. Shift & Diff
11. Aggregation & Resampling
12. Resampling
13. Rolling Aggregations
14. Key Takeaways
15. Excercise
Topics:
01. Preprocessing with read_csv
02. Column Selection
03. Row Selection & Missing Values
04. Parsing Dates & Data Types
05. OConverters
06. Importing Data
07. Importing from Text & Excel Files
08. Exporting to Flat Files
09. Importing & Exporting Excel Data
10. Working With SQL Databases
11. Other Supported File Formats
12. Key Takeaways
13. Excercise
Topics:
01. Why Multiple Tables
02. Appending DataFrames
03. Joining DataFrames
04. Join Types
05. Inner Joins
06. Left Joins
07. The Join Method
08. Key Takeaways
09. Excercise
Data Visualisation Using Python with Matplotlib and Seaborn Course Contents
From there we'll dive into Matplotlib fundamentals, and practice building and customizing line charts, bar charts, pies & donuts, scatterplots, histograms and more. We'll break down the components of a Matplotlib figure and introduce common chart formatting techniques, then explore advanced customization options like subplots, GridSpec, style sheets and parameters.
Finally we'll introduce Python's Seaborn library. We'll start by building some basic charts, then dive into more advanced visuals like box & violin plots, PairPlots, heat maps, FacetGrids, and more.
WEEK 9-11 | 5 Modules | 12 Hours | 19 Skills
Topics:
01. Course Structure & Outline
02. DOWNLOAD: Course Resources
03. Introducing the Course Project
04. Setting Expectations
05. Jupyter Installation & Launch
Topics:
01. Why Visualize Data?
02. Essential Visuals
03. Chart Formatting & Storytelling
04. Common Visualization Mistakes
05. Key Takeaways
06. Excercise
Topics:
01. Intro to Matplotlib
02. Plotting Methods
03. Plotting DataFrames
04. Anatomy of a Matplotlib Figure
05. Chart Titles & Font Sizes
06. Chart Legends
07. Line Styles
08. Axis Limits
09. Figure Sizes
10. Custom Axis Ticks
11. Vertical Lines
12. Adding Text
13. Text Annotations
14. Removing Borders
15. Formatting Charts
16. Line Charts
17. Stacked Line Charts
18. Dual Axis Charts
19. Dual Axis Line Charts
20. Bar Charts
21. Stacked Bar Charts
22. Grouped Bar Charts
23. Combo Charts
24. Advanced Bar Charts
25. Pie & Donut Charts
26. Scatterplots & Bubble Charts
27. Histograms
28. Scatterplots & Histograms
29. Key Takeaways
30. Excercise
Topics:
01 Intro to Advanced Customization
02. Subplots
03. GridSpec
04. Color Options
05. Color Palettes
06. Style Sheets
07. rcParameters
08. Saving Figures & Images
09. Key Takeaways
10. Excercise
Topics:
01. Intro to Seaborn
02. Basic Formatting Options
03. Bar Charts & Histograms
04. Box & Violin Plots
05. Linear Relationship Charts
06. Jointplots
06. PairPlots
07. Heatmaps
08. FacetGrid
09. Matplotlib Integration
10. Key Takeaways
11. Excercise
Data Science with SQL Server (and Azure SQL Database) Course Contents
You'll learn how to read and write complex queries to a database using one of the most in-demand skills - Microsoft SQL Server. These skills are also applicable to any other major RDBMS database, such as MySQL, PostgreSQL, Amazon Redshift, Oracle, and much more.
Data science is a dynamic and growing career field that demands knowledge and skills based on SQL to be successful. This course is designed to provide you with a solid foundation in applying SQL skills to analyze data and solve real business problems.
Whether you have successfully completed the other courses in the Learn SQL for Data Science and Data Analytics or are taking just this course, this roadmap is your chance to apply the knowledge and skills you have acquired to practice important SQL querying and solve problems with data. You will participate in your own personal or professional journey to create a portfolio-worthy piece from start to finish. You will choose your own dataset and develop a project proposal. You will explore your data and perform some initial statistics you have learned through this course. You will uncover analytics for qualitative data and consider new metrics that make sense from the patterns that surface in your analysis. You will put all of your work together in the form of a presentation where you will tell the story of your findings.
Learning SQL for Data Science is one of the fastest ways to improve your career prospects as it is one of the most in-demand tech skills! In this course, you'll learn quickly and receive challenges and tests along the way to improve your understanding!
WEEK 12-16 | 28 Modules | 30 Hours | 19 Skills
01. What is Data?
02. What are Databases?
03. Relational Database Management System (RDBMS)
01. Section Introduction
02. What is SQL Server
03. What is SQL
04. SQL Dialect
05. What is Transact SQL
06. Hardware and Software Requirements
07. SQL Server Editions
08. Download SQL Server
09. Install SQL Server
10. Install SQL Server Management Studio
11. Connect to SQL Server with SSMS
12. Install sample database
13. Exercises
01. What is Azure?
02. What is Azure SQL
03. Creating Azure Account
04. How to access azure services
05. Create a database using azure portal
06. Query SQL Database with Portal
07. Exercises
01. Installing SSMS
02. Connecting to Azure SQL Database with SSMS
03. insert data into azure SQL database
04. Update Data in an azure SQL Database
05. Delete Data from an azure SQL database
06. Create tables in Azure SQL with SSMS
07. Create database diagrams
08. Install Command line utilities
09. Bulk Load Data using BCP
10. Query data with SSMS
01. What is Azure Data Studio
02. Install Azure Data Studio
03. Connect to Azure SQL Database
04. Create a new database
05. Create a table
06. Insert Data rows
07. View the Data returned by Query
08. Exercises
01. Installing SandDance Extension
02. Visualization Charts
03. Multiple Table Data Charts
01. Type Decision for Data Analysis
02. Data Analysis with Case Statement and String Text
01. Section Introduction
02. Overview of Databases
03. Creating Database
04. SQL Data Types
05. Column Data Types on SSMS
06. Creating Table
07. Overview of Primary Key and Foreign Key
08. Primary Key
09. Foreign Key
01. Section Introduction
02. SQL Data Types
03. Numeric Data Type
04. String Data Type
05. Importance of Data Types
01. Section Introduction
02. CREATE, DROP, ALTER
03. Adding comments to query
04. Null & Not Null – SQL Constraint
05. Add a Default Constraint
06. Add a Unique Constraint
07. Primary Key Constraint
08. Using IDENTITY in SQL
01. Section Introduction
02. SELECT statement
03. WHERE clause
01. Section Introduction
02. UPDATE command
03. DELETE command
04. Adding Aliases
05. Decimal Data Type – Numeric Data Type
01. Section Introduction
02. CONCAT Function
03. CONCAT_WS Function
04. LEFT Function
05. RIGHT Function
06. LEN Function
07. UPPER Function
08. LOWER Function
09. LTRIM, RTRIM, TRIM Functions
10. REPLACE Function
11. SUBSTRING Function
12. COALESCE()
01. NOT NULL Constriant
02. UNIQUE Constraint
03. PRIMARY KEY Constraint
04. FOREIGN KEY Constraint
05. CHECK Constraint
06. Many Different Options while performing insert update and delete operations
01. Introduction
02. Filtering data with basic equality filters
03. Filtering data with basic comparisons
04. Filtering data with logical comparisons
05. Filtering data with String Comparisons
06. Filtering data with NULL Comparisons
01. Section Introduction
02. Insert character value with apostrophe/single quote
03. Order By Clause
04. Sorting by ascending
05. Sorting by descending
06. Sorting by multiple columns
07. DISTINCT Statement
08. TOP Clause
09. OFFSET & FETCH
10. % Percentage Wildcard
11. Underscore Wildcard
01. Introduction
02. Understanding Grouping
03. Aggregate Functions
04. COUNT Function
05. AVERAGE Function
06. SUM Function
07. MAX Function
08. MIN Function
09. Aggregate Functions with the GROUP BY Clause
10. Aggregate Functions with the HAVING Clause
11. Aggregate Functions with SELECT Command
12. Group By Clause using Single and Multiple Columns
13. Difference Between WHERE and HAVING Clause
14. Using Aggregates to Clean Data and Examine Data Quality
15. IN Operator
16. Sub Queries
17. Exercises
01. What are SET Operators
02. Query Data with EXCEPT
03. Query Data with INTERSECT
04. Query Data with UNION
01. What are Ranking Functions
02. NTILE Functions
03. Rank Functions
04. DENSE RANK Functions
05. ROW NUMBER FUNCTIONS
06. Miscellaneous Functions
01. What are Analytic Functions
02. Syntax for Analytic Functions
03. CUME DIST Function
04. Row Number Functions
05. Using LEAD Function
06. Using the LAG Function
07. Using FIRST_VALUE Function
08. Using LAST VALUE Function
09. Using PERCENT RANK Function
10. Using PERCENT COUNT Function
11. Using PERCENTILE DISC Function
01. Section Introduction
02. Date & Time Data Type
03. Extract Part of Date Values
04. GETDATE Function
05. CURRENT_TIMESTAMP
06. DATEPART Function
07. DATEDIFF Function
08. DATEADD Function
09. DATE Format
10. TIME Format
11. DATE&TIME Format
12. CAST & CONVERT - More Date & Time Format
01. Section Introduction
02. Understanding Comparison Operators
03. Equal
04. Not Equal
05. Greater Than
06. Less Than
07. Greater Than or Equal
08. Less Than or Equal
01. Section Introduction
02. AND
03. OR
04. BETWEEN
05. LIKE & NOT LIKE
06. Case Statement
01. Section Introduction
02. Understanding Data Relationship
03. One to One Relationship
04. One to Many Relationship
05. Many to Many Relationship
06. Normalization
07. RIGHT JOIN
08. FULL JOIN
09. Many to Many
01. Overview of Joins
02. What are Joins
03. Inner join
04. Left outer join
05. Right outer join
06. Full outer join
07. Union
08. Cartesian Product with the Cross Join
09. Exercise
01. Section Introduction
02. Import Flat File
03. Import .csv or excel file
04. Export Data to Excel or any format
01. Section Introduction
02. Creating Database backup
03. Restoring Database backup
01. Download Sample Database
02. Install Sample Database
03. Data Analysis of Countries with Customers
04. Data Analysis of Customer and Employee Count
05. Data Analysis of Customer Contact Titles
06. Data Analysis of Customers and Employee Count
07. Data Analysis of Employee Age with Date Time
08. Data Analysis of Employee Full Name
09. Data Analysis of Employee BirthDate in Age Order
10. Data Analysis of Customer First Order
11. Data Analysis of discontinued products
12. Data Analysis of Shippers
13. Data Analysis of Most and least expensive products
14. Data Analysis of Orders placed: List of Shippers Query
15. Data Analysis of Orders shipped to specific countries
16. Data Analysis of First order placed query
17. Data Analysis of products stock
18. Data Analysis of specific products
19. Data Analysis of Total price
20. Data Analysis of Sales Reps
21. Data Analysis of Query to show Sales Reps
22. Data Analysis of Restricted Fields
23. Data Analysis of Query to show Sales Reps in a country
24. Data Analysis of Query to check specific products
25. Data Analysis of Query to get suppliers details
26. Data Analysis of Query to Check Products Stock
27. Data Analysis of Query to check orders Shipped
Data Analysis with Power BI
Course Contents
Before diving into creating visualizations using Power BI's drag-and-drop functionality, you’ll first learn how to confidently load and transform data using Power Query and the importance of data models. You’ll also learn to drill down into reports and make your reports fully interactive.
You’ll start by looking at some of the fundamentals of Power BI, getting to grips with Data, Model, and Report views. You’ll learn to load data sets, build a data model, and discover how to shape and transform your data with Power Query Editor. As you progress through the course, you’ll have access to hands-on exercises that can hone your skills. You’ll look at various visualizations, sort different data types, and learn to drill deeper into your reports.
Once you've covered Power BI in general, you can dig into its options for data visualization. Learn to choose the right visual for your dataset and type, how to make changes to follow visualization best practices and tell a strong story with your data, and learn to sort and format your data for clearer storytelling.
WEEK 17-18 | 2 Modules | 6 Hours | 19 Skills
01. What is Power BI?
02. Why Power BI?
03. Advantages Of Power BI
04. Disadvantages Of Power BI
05. Power BI Architecture
06. Power BI Service
07. Power BI Dashboard
08. Components of Power BI
09. Features of Power BI
10. Power BI Career Opportunities
11. Power BI Certifications
12. Power BI Analyst Salary
13. Versions Of Power BI
14. Who Uses Power BI Applications?
15. Case Study on Meijer
16. Exercises
01. What is Power BI?
02. Features of Power BI
03. What is a Power BI Dashboard?
04. Advantages of a Power BI dashboard
05. Power BI Dashboards vs Report
06. sHow to Create a Dashboard in Power BI?
07. Exploring the Features of Power BI Service
08. Exercises
BECOME A DATA ANALYTICS & VISUALIZATION EXPERT
DATA ANALYSIS, SCIENCE & VISUALIZATION
USING PYTHON - Pandas, Numpy, Matplotlib, Seaborn AND AZURE SQL
Your total savings: £ 1,600
1. Python Foundations for Data Analysis & Business Intelligence - £500
2. Data Analysis Using Python with NumPy and Pandas - £550
3. Data Visualisation Using Python with Matplotlib and Seaborn - £550
4. Data Science with SQL Server (and Azure SQL Database) - £550
5. Data Analysis with Power BI- £350
Data Analytics & Visualization Job Outlook
Ranked #1 Programming Language
TIOBE and PYPL ranks Python as the most popular programming language globally.
Salary Trend
The average salary for a Python Developer is $114,489 per year in the United States.
44.8% CAGR
The global python market size is expected to reach USD 100.6 million in 2030.
Job Titles include
- Python Developer
- Data Analyst
- Data Scientist
- AI Engineer
- AI Researcher
- Machine Learning Engineer
GreaterHeight Academy Benefits
Unlimited Live Sessions
Live Training Membership give you unlimited access to all our live training and sessions recording from anywhere and using any device staying at home.
Expert-led Live Sessions
All sessions are led by our expert mentors who are well connected to the open-source communities. They explain complex technical concepts in an easy way.
Test and Quizzes
Each Module will be followed by mock-up tests and quizzes which help you to monitor your learning progress and evaluate yourself.
Build Real-Projects
All the sessions are delivered using real-life. You will learn how to build real projects using industry recommended principles & practices.
Personal Career Coach
Get career guidance from top experts as your personal coach, align your preparation strategy & learning resources to achieve your goal.
Interview Prep Sessions
Get career guidance and ask your questions & doubts live. Join to prepare yourself for next job interview to crack and get hired!
Resume Building
Optimize your resume with the help of our experienced experts to get your desired jobs.
Hands-on Assignments
Learn by doing hands-on to gain confidence to solve real-world challenges and assignments. Interview Prep Sessions.
Community Access
Get access to WhatApps community to discuss doubts, access assignments and learning with peer interaction.
Technical Support
We have online support team available to help you with any technical queries you may have during the course.
Get Certified
Master in-demand job skills to become a technology expert, get certified, and accelerate your career.
Career & Certifications

Our advisor is just a call away
![]() +1 5169831065
+1 5169831065
+44 7474 275645
Available 24x7 for your queries
- Data Analytics is a process of inspecting, cleaning, transforming and modeling data to discover useful information and support decision making to achieve business goals.
- There are various data analysis qualitative and quantitative methods and analytical or statistical tools used to extract the useful information and translate them into insights to make better business decisions, most of which are covered in the Data Analyst Courses.
- The data analyst serves as a gatekeeper for an organization’s data so stakeholders can understand data and use it to make strategic business decisions. It is a technical role that requires an undergraduate degree or master’s degree in analytics, computer modeling, science, or math.
- The business analyst serves in a strategic role focused on using the information that a data analyst uncovers to identify problems and propose solutions. These analysts typically earn a degree in a major such as business administration, economics, or finance.
- The data scientist takes the data visualizations created by data analysts a step further, sifting through the data to identify weaknesses, trends, or opportunities for an organization. This role also requires a background in math or computer science, along with some study or insight into human behavior to help make informed predictions.
- Some of the top industries using data analysis include Data Assurance, Retail, Finance, Entertainment, Government and Public sector, Higher Education, Sharing economy services, Sales & Marketing, Agriculture, Business Intelligence, Healthcare, and Data Quality.
- There is undoubtedly great demand for data analytics as 96% of organizations seek to hire Data Analysts. The most significant data analyst companies that employ graduates who wish to have a data analyst career are Manthan, SAP, Oracle, Accenture Analytics, Alteryx, Qlik, Mu Sigma Analytics, Fractal Analytics, and Tiger Analytics. Professional Data Analyst training will make you become a magician of any organization, and you will spin insights by playing with big data.
A successful data analyst possesses a combination of technical skills and leadership skills.
- Technical skills include knowledge of database languages such as SQL, R, or Python; spreadsheet tools such as Microsoft Excel or Google Sheets for statistical analysis; and data visualization software such as Tableau or Qlik. Mathematical and statistical skills are also valuable to help gather, measure, organize, and analyze data while using these common tools.
- Leadership skills prepare a data analyst to complete decision-making and problem-solving tasks. These abilities allow analysts to think strategically about the information that will help stakeholders make data-driven business decisions and to communicate the value of this information effectively. For example, project managers rely on data analysts to track the most important metrics for their projects, to diagnose problems that may be occurring, and to predict how different courses of action could address a problem.
- Career openings are available practically from all industries, from telecommunications to retail, banking, healthcare, and even fitness. Without extensive training and effort, it isn't easy to get data analyst career benefits. So, earning our Data Analyst certification will allow you to keep up-to-date on recent trends in the industry.
You will work on highly exciting projects in the domains of high technology, ecommerce, marketing, sales, networking, banking, insurance, etc. After completing the projects successfully, your skills will be equal to 6 months of rigorous industry experience.

Greaterheight Academy in Parnership With Abbfem Training
We have worked with Abbfem Consulting to bring this course for your benefit.